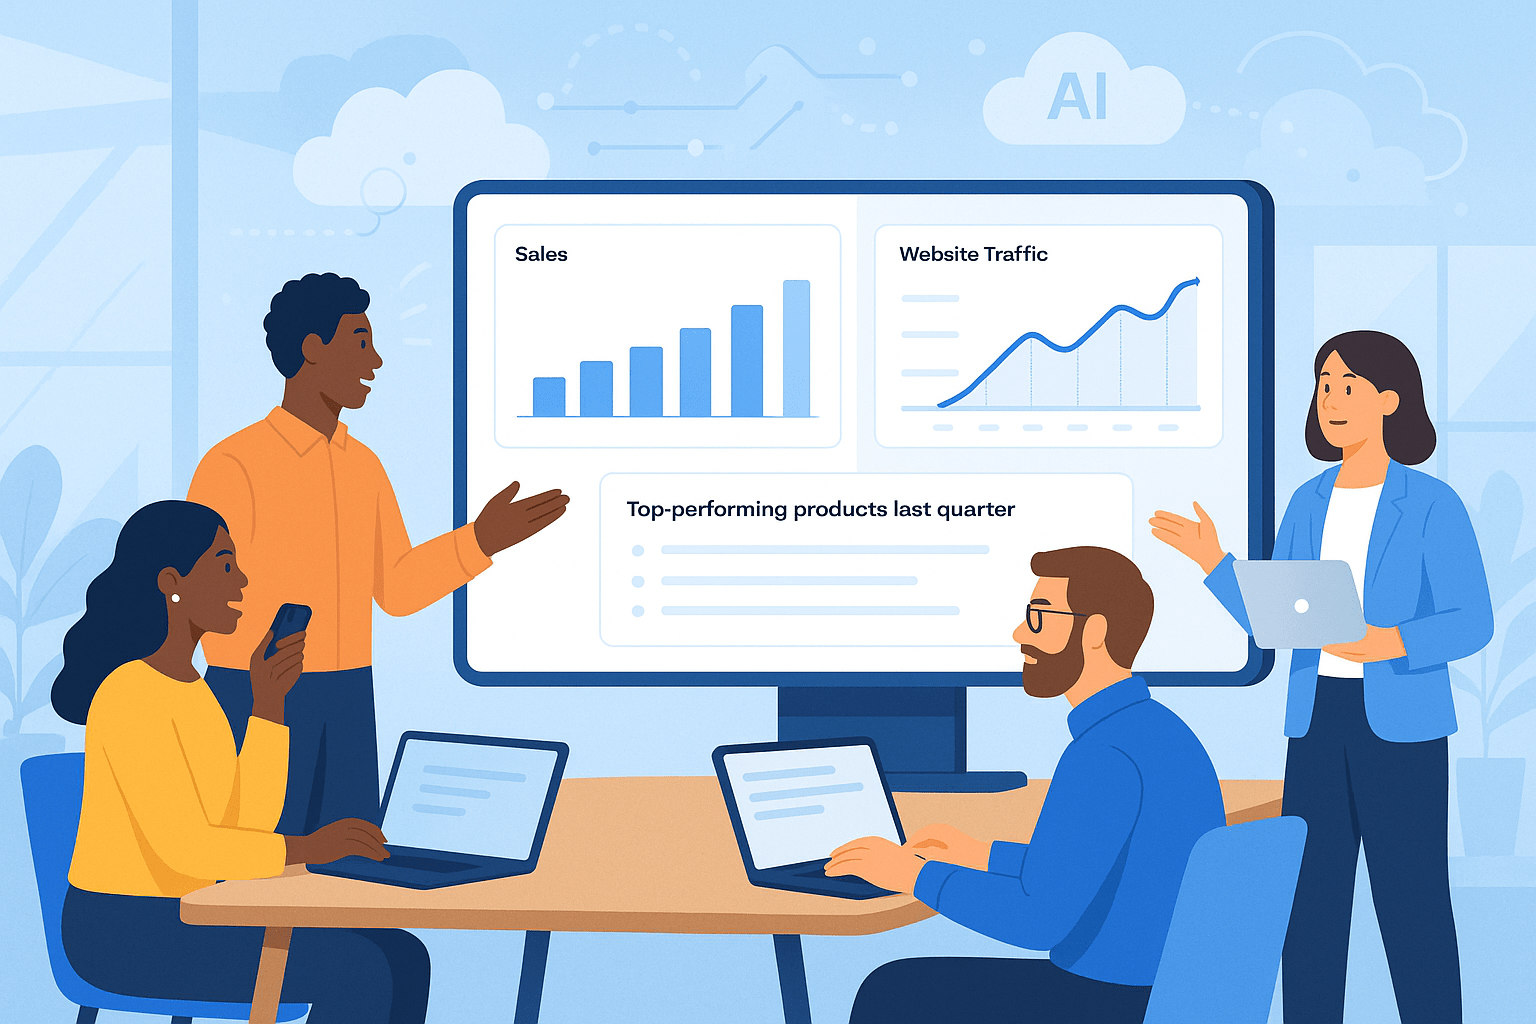
Introduction: The New Paradigm in Business Intelligence
For decades, business intelligence (BI) tools promised to make organizations more data-driven. Yet, the reality is that despite significant investments in BI platforms, true data democratization has remained elusive. Most business users still struggle to access insights when they need them, often relying on data specialists to extract and interpret information.
Conversational Analytics is changing this paradigm. By enabling users to interact with data using everyday language, Conversational Analytics is breaking down the barriers that have kept BI in the hands of a few. The result is a significant leap toward true self-service analytics—where every user can get trustworthy answers, ask follow-up questions, and derive insights at the speed of business.
What Is Conversational Analytics?
Conversational Analytics refers to technologies that allow users to query and analyze data using natural language, whether through text or voice. Instead of navigating complex dashboards or writing SQL queries, users can simply ask questions in plain language:
- “What were our top 5 products by revenue last quarter?”
- “Show the trend of customer churn in the past year.”
- “Break down employee turnover by department for the last six months.”
The analytics platform translates these queries into appropriate data operations, retrieves answers from governed data sources, and presents results in an intuitive format—sometimes with the option for visualization, context, or even proactive insights.
Why Conversational Analytics Matters
1. Democratization of Data Access
Historically, the power of BI has been limited by technical barriers—complex tools, unfamiliar data models, and the need for SQL knowledge. Conversational Analytics removes these obstacles, allowing any employee—regardless of technical skill—to interact with organizational data.
Example:
A sales manager can simply ask, “How did Q2 sales in the Western Cape compare to Q1?” and instantly receive a chart or table, no analyst required.
2. Trusted and Consistent Insights
Leading Conversational Analytics solutions are built on governed data models and metadata. This ensures that answers are always consistent, aligned with business definitions, and free from ad-hoc spreadsheet errors.
For example, solutions like Looker use model layers (e.g., LookML), but this principle applies universally: analytics should reflect business logic as defined by data experts.
3. Transparency and Explainability
Modern platforms now reveal how each answer is calculated. Users see clear, plain-language explanations—e.g., “Total revenue = sum of all completed order values in the selected region and date range”—building trust and data literacy.
4. Conversational Exploration and Iteration
The real breakthrough is in conversational flow: users can ask follow-up questions (“Show only retail customers” or “Change chart to area graph”), filter results, or dive deeper without resetting their session. This mirrors natural business conversations and makes analysis iterative and dynamic.
5. Unlocking Hidden Insights with AI
AI-powered analytics engines can now surface patterns and anomalies that users might not know to ask for. After a query, the system might highlight, “Notice a 12% spike in signups in March,” or suggest, “Would you like to see the top drivers for customer churn?”
Impact for Different Stakeholders
- Business Users: Gain autonomy to answer their own questions, leading to faster, better decisions.
- Data Analysts: Spend less time on routine queries, and more time on strategic, value-adding analysis.
- IT & Data Stewards: Maintain governance and security, as queries are routed through approved data models.
- Executives: Foster a data-driven culture across all levels, increasing the ROI of analytics investments.
Practical Applications
- Sales: “Which products had the fastest sales growth this year?”
- HR: “What’s the attrition rate by department and seniority?”
- Finance: “Compare quarterly revenue across business units.”
- Operations: “Identify regions with the most late deliveries this month.”
Best Practices for Implementing Conversational Analytics
- Invest in Data Modeling: Ensure that your data sources are clean, well-modeled, and mapped to business concepts. Conversational tools are only as good as the data foundations they sit on.
- Prioritize Governance and Security: All conversational queries must pass through governed layers, so business logic and access controls are always enforced.
- Promote Data Literacy: Use transparency features (“How was this calculated?”) to upskill users and foster trust.
- Start with Targeted Use Cases: Roll out to business domains where the value is highest and user demand is strongest.
- Enable Feedback Loops: Let users flag ambiguous answers and provide input, so models improve over time.
Looking Ahead: The Future of Conversational BI
Conversational Analytics is not a passing trend; it is the future of business intelligence. As AI and natural language technologies mature, expect platforms to become even more intuitive, proactive, and context-aware—able to anticipate business questions, suggest new lines of inquiry, and even automate decisions.
For organizations, the imperative is clear: adopting Conversational Analytics is no longer optional for those seeking a competitive edge. The sooner teams are empowered to “talk to their data,” the more agile, innovative, and resilient the business becomes.
Conclusion:
The next wave of BI is here. Conversational Analytics is making trusted, data-driven decision-making a reality for everyone, not just the data elite. The organizations that embrace this shift will unlock the true value of their data—at every level.