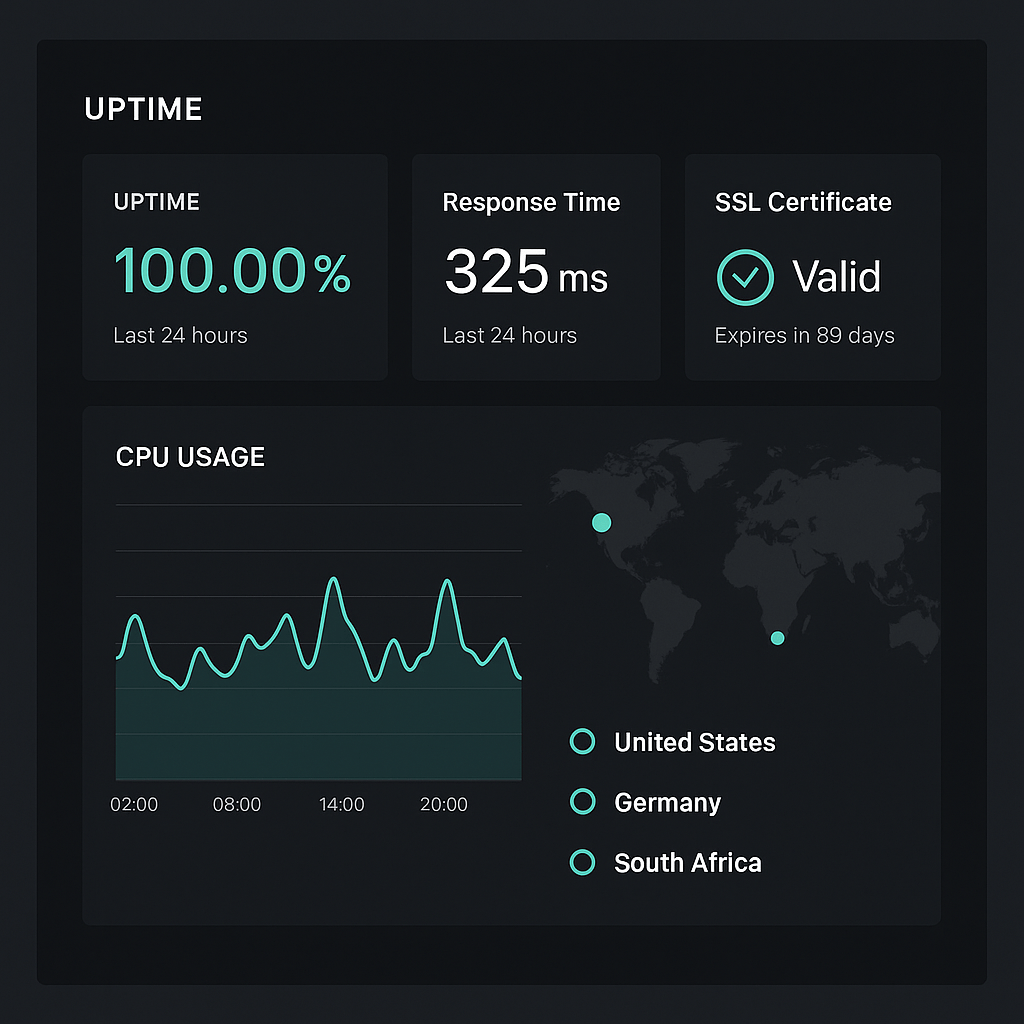
The platform at https://monitoring.acalytica.com is an uptime and cronjob monitoring system designed for simplicity, control, and observability across digital assets. It functions as a lightweight full-stack telemetry suite for digital reliability assurance.
Core Functional Domains
Website and Server Monitoring
- HTTP/HTTPS uptime and latency checks
- Multi-location probes (USA, Germany, South Africa) for regional performance comparison
- Port and protocol testing for services beyond web endpoints
- IPv6-ready network stack
Cronjob and Process Monitoring
- Tracks task execution health via incoming GET/POST requests
- Detects silent failures or delayed runs
- Generates uptime and failure reports (weekly or monthly)
DNS, SSL, and Domain Intelligence
- Continuous DNS record surveillance (A, AAAA, MX, TXT, CNAME, NS, SOA, CAA)
- SSL certificate expiry tracking and domain-renewal alerts
- DNS hijacking detection through differential record logging
Incident and Notification System
- 13+ integration channels for alerts (email, webhook, Slack, etc.)
- Configurable escalation and severity thresholds
- Detailed downtime cause logs and restoration timestamps
Public and Private Status Pages
- Custom domains, SEO-ready templates, and optional password protection
- Real-time uptime visualisation and historical trend data
- Lightweight design with GTmetrix grade A performance
Analytics and Reporting
- Geographic and device analytics for status-page visitors
- Daily uptime statistics with visual trendlines
- Automated weekly and monthly summaries
Server Resource Telemetry
- CPU usage, load averages (1/5/15-min)
- RAM, disk, and network usage
- Custom alerts for threshold breaches across Linux, Windows, and macOS environments
Conceptual Summary
The system serves as a self-sovereign observability stack merging uptime monitoring, domain intelligence, and server resource tracking under one control plane. Its design principle: visibility without dependency, a single interface to pre-empt downtime, misconfigurations, or certificate lapses before they become user-visible incidents.