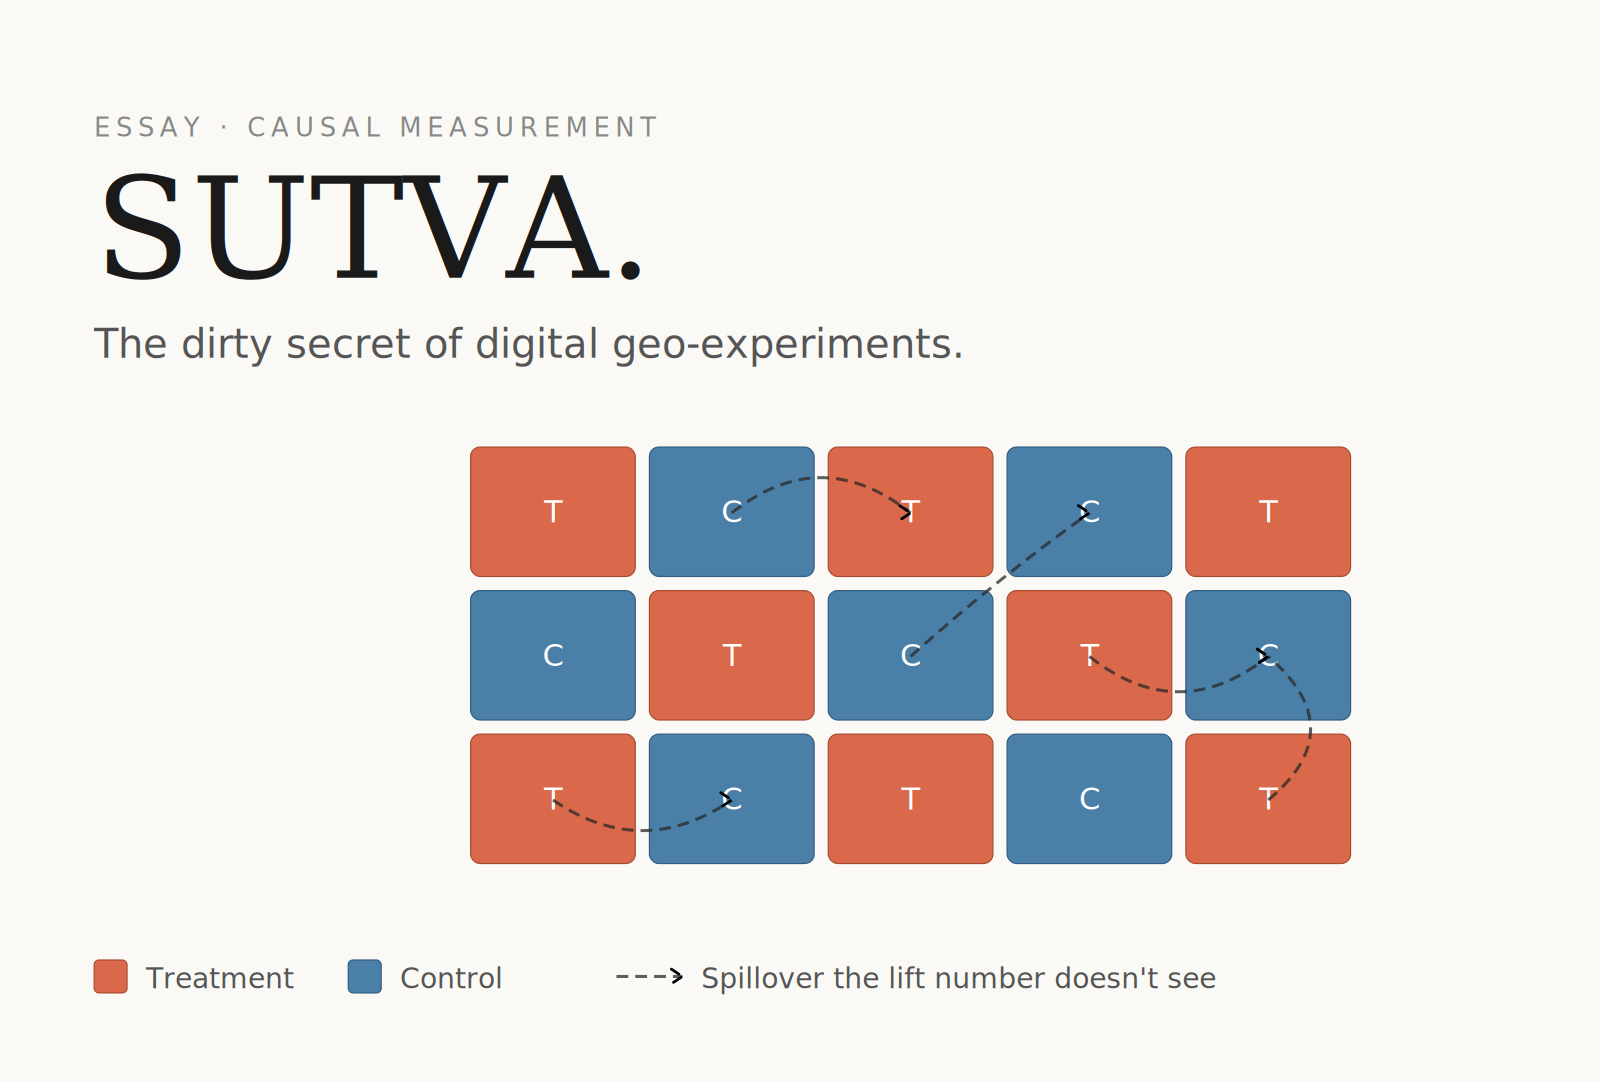
The marketing measurement community has spent the last five years rediscovering experiments. As tracking-based attribution collapsed under iOS 14.5, cookie deprecation, and tightening privacy regimes, geo-experiments stepped in as the grown-up alternative. Randomise some DMAs into treatment, hold others out as control, measure the lift, divide by spend. Clean. Defensible. Causal.
Except it isn't. Or rather: it's more causal than last-click attribution, which is a low bar, but it isn't as causal as the slides imply. The reason has a name that almost no marketing deck mentions: SUTVA.
What SUTVA actually says
The Stable Unit Treatment Value Assumption is one of the foundational assumptions of causal inference. It has two parts, and the first one is the one that matters here:
No interference. The treatment assigned to one unit does not affect the outcome of any other unit.
In a clinical trial, SUTVA is usually fine. Whether your neighbour got the placebo doesn't change whether your blood pressure responds to the drug. The units are independent.
In a digital advertising geo-experiment, SUTVA is almost never fine. The units, DMAs, ZIP codes, audience cells, are tied together by at least four mechanisms that quietly contaminate the result. Most teams never quantify them, and a few don't know they exist.
The four ways interference sneaks in
1. Auction dynamics
This is the big one. Digital ads are sold in real-time auctions. When you split the country into treatment and control geos and pause your ads in the control cells, you don't just remove ad exposure from those users, you remove a bidder from those auctions. Your competitors' costs drop in the control geo, their reach goes up, and their share of voice expands.
Now compare the two cells. In treatment, users see your ads in a competitive auction environment. In control, users see more of your competitors' ads than they would in a steady-state world. You are not measuring "your ads versus no ads." You are measuring "your ads versus a counterfactual world where your competitors got cheaper inventory." The lift you report includes a competitor-substitution effect that wouldn't exist if you actually cut the channel for real.
The direction of the bias is usually upward. Your reported incrementality is flattered by the fact that the control cell isn't a clean absence, it's an absence plus an enriched competitor presence.
2. Budget reallocation by the platform
This one is subtler and arguably worse. Modern ad platforms, Meta's Advantage+, Google's Performance Max, TikTok's Smart Performance Campaigns, are not passive ad servers. They are budget-pacing optimisers. When you pause campaigns in some geos and not others, the platform doesn't just spend less. It redistributes the spend you didn't use in the control geos toward the geos where you're still active.
So your treatment cell isn't getting your normal level of investment. It's getting your normal level plus the redirected budget that would have gone to control. The auction in the treatment cell becomes more crowded with your own ads than it would be in steady state. Frequency goes up. Reach goes up. Lift goes up, but not because your ads are more effective, only because you accidentally over-invested in the cell you're measuring.
This bias is also upward, and it can be substantial. Some published case studies have shown 20–40% of measured "lift" disappearing once budget reallocation is properly controlled for.
3. Geographic and demographic spillover
DMAs are not airtight. People travel, commute, and live in border regions where one DMA's TV market overlaps with another's media consumption. They cross devices, share households, and increasingly consume content that ignores geography entirely (YouTube, Instagram, TikTok). A user assigned to a "control" DMA who works in a "treatment" DMA may see the ad on her phone at lunch and convert from her home address that night.
Spillover dilutes the contrast between cells. It usually biases the measured effect downward, making real lift look smaller than it is. So unlike the first two, this one cuts in the opposite direction. Which is in some ways more dangerous: it means the auction and budget biases are partially masked by spillover, and the net direction of the error is unknowable without explicit modelling.
4. Social and network effects
For brand-driven categories, exposure has second-order effects. A user in the treatment cell who sees the ad tells a friend in the control cell. A piece of creative goes mildly viral and spreads through organic channels that don't respect geo boundaries. Word-of-mouth, referral, and shared-decision purchases (a couple buying a sofa, a family choosing a holiday) all move outcomes across the treatment-control boundary.
This is most acute for brands with strong word-of-mouth dynamics, DTC, fashion, consumer tech, and least acute for low-consideration impulse categories. Either way, it violates SUTVA, and almost no geo-experiment design accounts for it.
Why this isn't a footnote
The standard defence of geo-experiments is something like: "Sure, there's some interference, but it's small, and the experiment is still much better than observational attribution." The first half of that sentence is unfalsifiable as usually deployed, nobody measured the interference, they just hope it's small. The second half is true but irrelevant. The question isn't whether geo-experiments beat last-click. They obviously do. The question is whether the lift number you're putting in the boardroom deck is the actual causal effect, or a number that's contaminated by mechanisms you haven't acknowledged.
For most published incrementality results in ad-tech, the honest answer is: we don't know. The four interference mechanisms point in different directions. Auction dynamics and budget reallocation inflate the result. Spillover deflates it. Network effects can do either. The net bias depends on category, platform, geographic granularity, the platform's pacing algorithm, and the competitive landscape during the test window, and almost no measurement vendor reports any of this.
This matters because incrementality results are increasingly being used to make seven- and eight-figure budget decisions. A 30% measured lift that's actually a 15% true lift, inflated by auction substitution and budget reallocation, leads directly to over-investment in the channel. The team congratulates itself on rigorous measurement. The CFO funds the next quarter at the inflated number. The bias compounds.
What honest practice looks like
There is no clean fix. There are only partial mitigations, and the most useful thing a measurement team can do is acknowledge which ones they've applied and which they haven't.
Use larger geographic units. Country-level holdouts have less spillover than DMA-level, which have less than ZIP-level. The trade-off is statistical power and cost, you need a lot of countries to randomise at country level. For most brands, state or DMA is the realistic floor.
Run switchback designs where feasible. Instead of holding out geos, hold out time periods in the same geos, alternating treatment and control on a schedule. This eliminates cross-geo spillover entirely. It introduces its own problems, temporal autocorrelation, day-of-week effects, slower readouts, but for short-horizon conversion behaviours it can be a cleaner design.
Lock budget pacing. If your platform allows it, set hard daily caps in the treatment cells matched to steady-state spend, so the platform can't reallocate redirected control-cell budget into your treatment measurements. This is operationally annoying and reduces the platform's optimisation, which the platform's account team will resist. Do it anyway.
Model the auction explicitly. The frontier work in causal advertising measurement now includes structural models of the auction itself, explicitly representing competitor bidding behaviour and using equilibrium analysis to back out the partial effect of your own absence. This is hard. It requires either platform cooperation or strong assumptions. But it's the only approach that addresses the auction-substitution bias head-on rather than hoping it's small.
Triangulate. No single experiment is definitive. A geo-test, a switchback test, a synthetic-control analysis on natural variation, and a calibrated MMM should all roughly agree before you bet the budget on a number. When they disagree, and they will, the disagreement is the finding.
The deeper point
The Pearl-influenced future of marketing measurement that everyone is now writing about will be much more honest about identification strategies than the last decade was. That's good. But causal inference is not a switch you flip. Moving from rung-one attribution to rung-two incrementality measurement doesn't end the epistemic work, it relocates it. The assumptions you used to hide inside "the algorithm knows best" you now have to make explicit, defend, and revisit.
SUTVA is one of those assumptions. In digital advertising, it is wrong by default, in multiple directions, by amounts nobody routinely measures. The right response isn't to abandon geo-experiments, they remain the best tool in the kit. The right response is to stop pretending the lift number is unbiased just because the design was randomised.
The cleanest-looking results in your incrementality deck are probably the ones that haven't yet been investigated carefully enough to look messy. That's not a reason to despair. It's a reason to be the team that actually does the investigation.