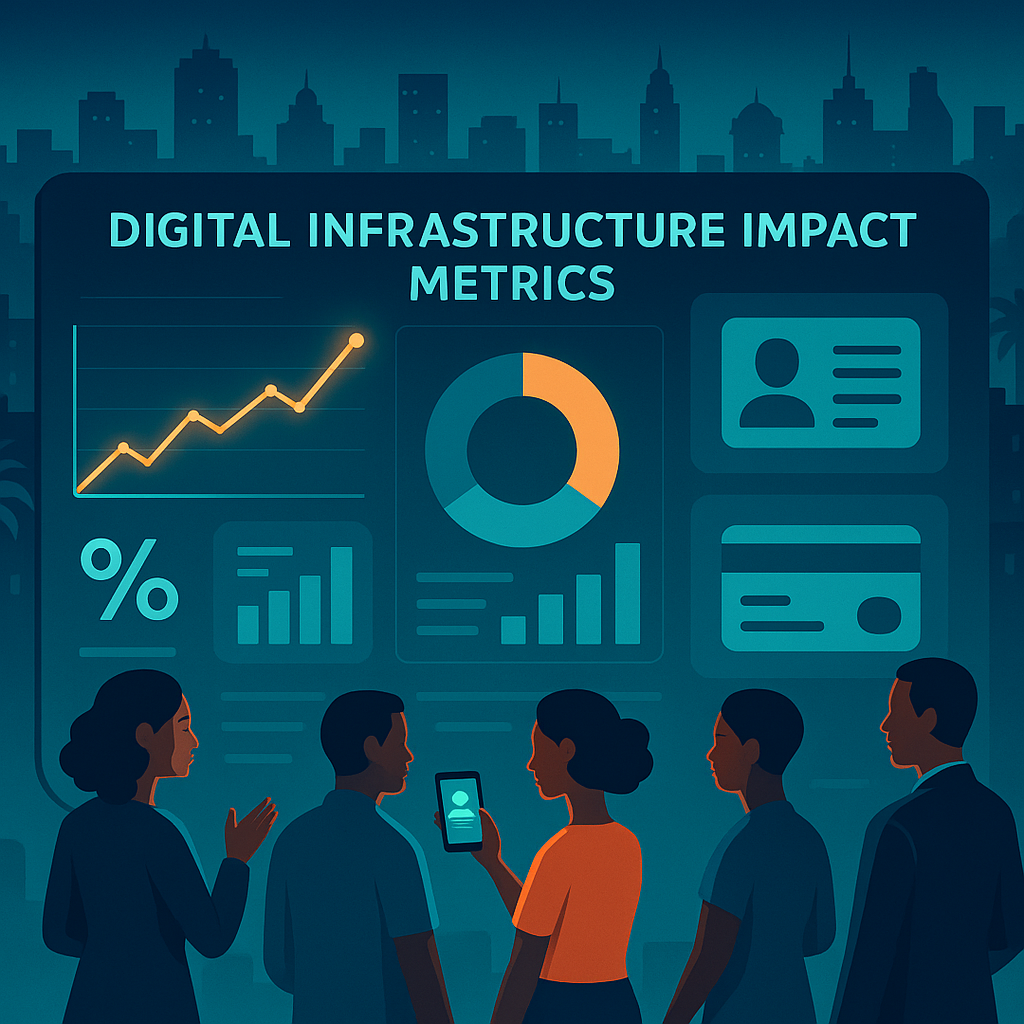
Digital Public Infrastructure (DPI) has emerged as one of the most consequential levers for accelerating inclusive growth, especially in the Global South. By enabling foundational digital capabilities—such as identity, payments, and data exchange—DPI can transform how societies deliver services, empower citizens, and stimulate innovation. But to move from potential to performance, DPI ecosystems must be evaluated with precision. This is where impact metrics come in.
From Infrastructure to Impact: Why Metrics Matter
Historically, infrastructure projects—digital or physical—have focused on deployment rather than use. DPI demands a different lens. Success is not just about building the pipes but ensuring that clean, affordable, and inclusive digital services flow through them. Measurement, therefore, becomes mission-critical.
Effective DPI impact metrics allow us to:
- Track system health and reliability
- Gauge reach and equity
- Quantify economic and developmental value
- Ensure trust, accountability, and good governance
- Align interventions with Sustainable Development Goals (SDGs)
More importantly, well-defined metrics help funders justify investments, guide public policy, and de-risk innovation by providing early signals of what's working.
Core Dimensions of DPI Impact
An effective DPI metrics framework typically covers five dimensions: system-level performance, inclusion and equity, usage and value creation, governance and trust, and macro-developmental impact. Together, they form a 360-degree view of whether DPI is functioning not just as technology—but as a catalyst for transformation.
1. System-Level Performance
At the most basic level, DPI must be technically sound. Metrics such as uptime, transaction latency, interoperability across systems, and standards compliance help establish the infrastructure's reliability. These metrics are foundational—they indicate whether DPI is operational and scalable.
2. Inclusion and Equity
DPI is only valuable if it reaches the people who need it most. Inclusion metrics examine how accessible the infrastructure is across gender, geography, income, disability, and language. These indicators help correct digital divides before they become entrenched. Affordability and digital literacy also fall within this scope, ensuring that usage barriers are identified and addressed.
3. Usage and Value Creation
This dimension assesses how DPI is actually used in practice. Are citizens and businesses using digital IDs to access services? Are digital payments replacing cash? Are startups and SMEs building on top of open APIs? Metrics here span transaction volumes, time saved in service delivery, cost savings to government and citizens, and private sector integration.
4. Governance and Trust
Without trust, DPI fails—no matter how powerful the tech. This is why metrics around data protection compliance, grievance redressal mechanisms, transparency in APIs and policies, and user consent flows are crucial. They ensure that DPI operates under social license and legal legitimacy.
5. Developmental Impact
Ultimately, DPI is a means to an end—especially in achieving national development goals and SDGs. Is it helping citizens get jobs, access healthcare, claim benefits, or pursue education? Is it improving public sector efficiency or formalizing the informal economy? This is where metrics bridge the gap between infrastructure and impact.
The Need for a North Star Metric
For cohesion across the ecosystem, it's helpful to define a North Star Metric—a single outcome that combines inclusion, frequency of use, and developmental utility. A compelling candidate is:
“Percentage of the population using DPI-enabled services to access critical life functions—such as income, identity, benefits, education, or healthcare.”
This composite indicator reflects both breadth and depth of DPI’s societal value. It also signals the maturity of the ecosystem: when citizens trust and rely on DPI for essential services, we know it’s working.
Embedding Metrics into DPI Lifecycles
Impact metrics shouldn’t be an afterthought or compliance burden. They must be embedded into the DPI lifecycle from design to deployment. This includes:
- Theory of Change alignment: Metrics must reflect intended societal outcomes.
- Open dashboards: Governments should publish performance and impact metrics to foster accountability.
- Feedback loops: Metrics should inform design iterations and funding decisions.
- Adaptive governance: Impact insights must translate into policy and regulation updates.
A Global Imperative, Localized in Context
While frameworks like those from the Digital Public Goods Alliance (DPGA), World Bank’s G2Px, GovStack, and UNDP offer global blueprints, measurement must be localized. What constitutes impact in South Africa may differ from India or Brazil. Metrics must reflect local digital readiness, infrastructure maturity, and development priorities.
The Call to Action: Measurement as a Public Good
In the DPI era, impact measurement itself becomes a public good. It enables transparency, builds trust, and maximizes collective returns on investment. Governments, multilateral institutions, DPI builders, and civil society must collaborate to define, implement, and openly publish DPI impact metrics.
Because in the end, what gets measured gets improved—and what gets improved changes lives.